

Splunk is the
platform for a million use cases, used to investigate operational data
across security, observability, fraud, business intelligence and many
other domains. But, in my time at Splunk, I’ve come to realize that all
of our customers face challenges that stem from the same core problem:
Within exploding data volumes, finding the anomalously behaving
entities that are most threatening to the resilience of their
organization.
Introducing the Splunk App for Behavioral Profiling,
a collection of workflows which enable you to operationalise detection
and scoring of behavioral anomalies at scale in complex environments,
correlated to profile and highlight the entities that are affecting
resilience – designed to help:
- Fraud Teams tasked with locating increasingly sophisticated
attackers that employ evolving methods across physical and digital
channels to avoid simplistic detection rules. - IT Operations supporting modern
infrastructure, services and solutions comprising many disparate parts,
any of which could be creeping towards an issue that compromises the
resilience of the platform and brings the entire service down. - Insider Threat Analysts attempting
to hunt the unusual behaviors pointing towards criminal activity whilst
grappling with inflexible solutions offering too little transparency
and too much complexity for teams to tune to their operations. - Platform Moderators chasing
malicious users, posting abusive or illegal material, directly affecting
revenue and customer sentiment without detection amid a marketplace of
inapplicable solutions for bespoke platforms.
Background
First, some foundational terminology.
I’ve used the term entity several times, but what is an entity?
Well, it’s anything – any mappable group of “things” within which you
can compare and find anomalous behaviors. Examples include: customers,
business units, employees, applications, servers, branches, etc.
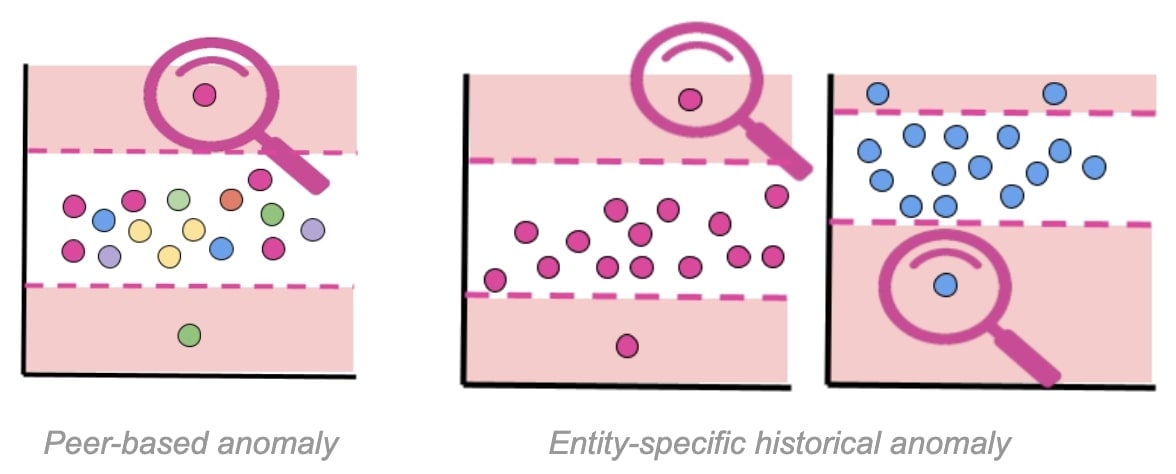
Meanwhile, a behavioral anomaly is a deviation from expected
behavior; either a difference between an entity and its peers, an entity
and its historic behavior, or some combination of the two.
Operationalising behavioral anomaly detections at scale, and
resolving back to the entities they relate to, has in the past been a
complex task with Splunk. It required understanding and implementation
of:
- Splunk’s Search Processing Language (SPL) to define a search
- Search scheduling to operationalise that search
- Machine learning and ML-SPL to define and interpret anomaly criteria
In addition, features such as summary indexing and KV storage need to be leveraged to truly scale anomaly searches to potentially
millions of entities.
The Splunk App for Behavioral Profiling comes to the rescue by
orchestrating all of the above behind a simple click-through workflow,
enabling you to deploy behavioral indicator searches with one line of
SPL, and introducing a simple scoring mechanism to focus attention away
from the false positives and towards the entities that truly matter.
Under the Hood
The app uses a three layer architecture to turn your raw data sources into behavior profiled entities:
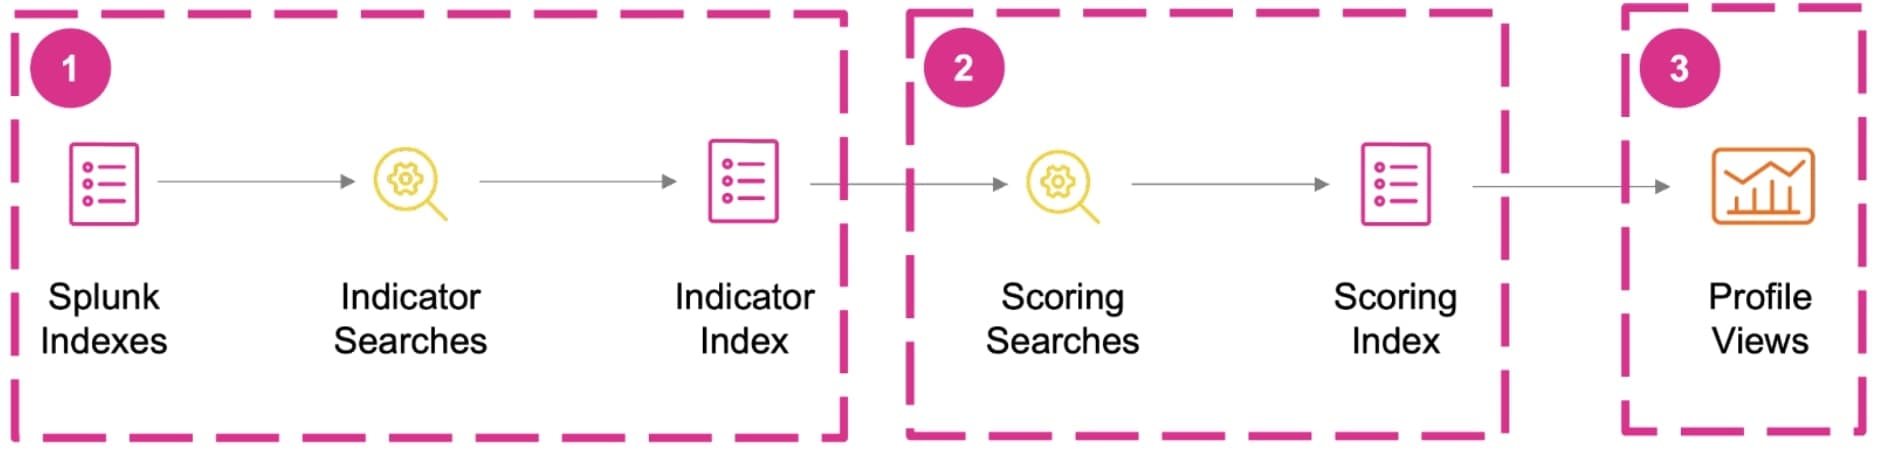
- First, indicator searches are deployed to track entity behaviors and
output the metrics to the indicator index on a user-defined schedule. - This indicator index is then used as the
feed for user-defined scoring rules, which leverage criteria ranging
from simple conditional logic (i.e. indicator value > 5000) to
machine learning based anomaly detection, enabling identification of the
anomalously behaving entities and attribute dynamic scores in the
scoring index. - The scoring index then populates a
behavioral dashboard to display a list of entities that are prioritized
by aggregated behavioral scores for investigation.
Deploy
Deploying an indicator search is as simple as pointing the workflow
towards a dataset, selecting the field which represents the unique
entity, and leveraging the dropdown menus to select a function to build
the indicator metric you’ll be tracking (alternatively more advanced
users can leverage SPL searches entirely). Once satisfied you can save,
schedule and immediately backfill the search through the pop-up menu.
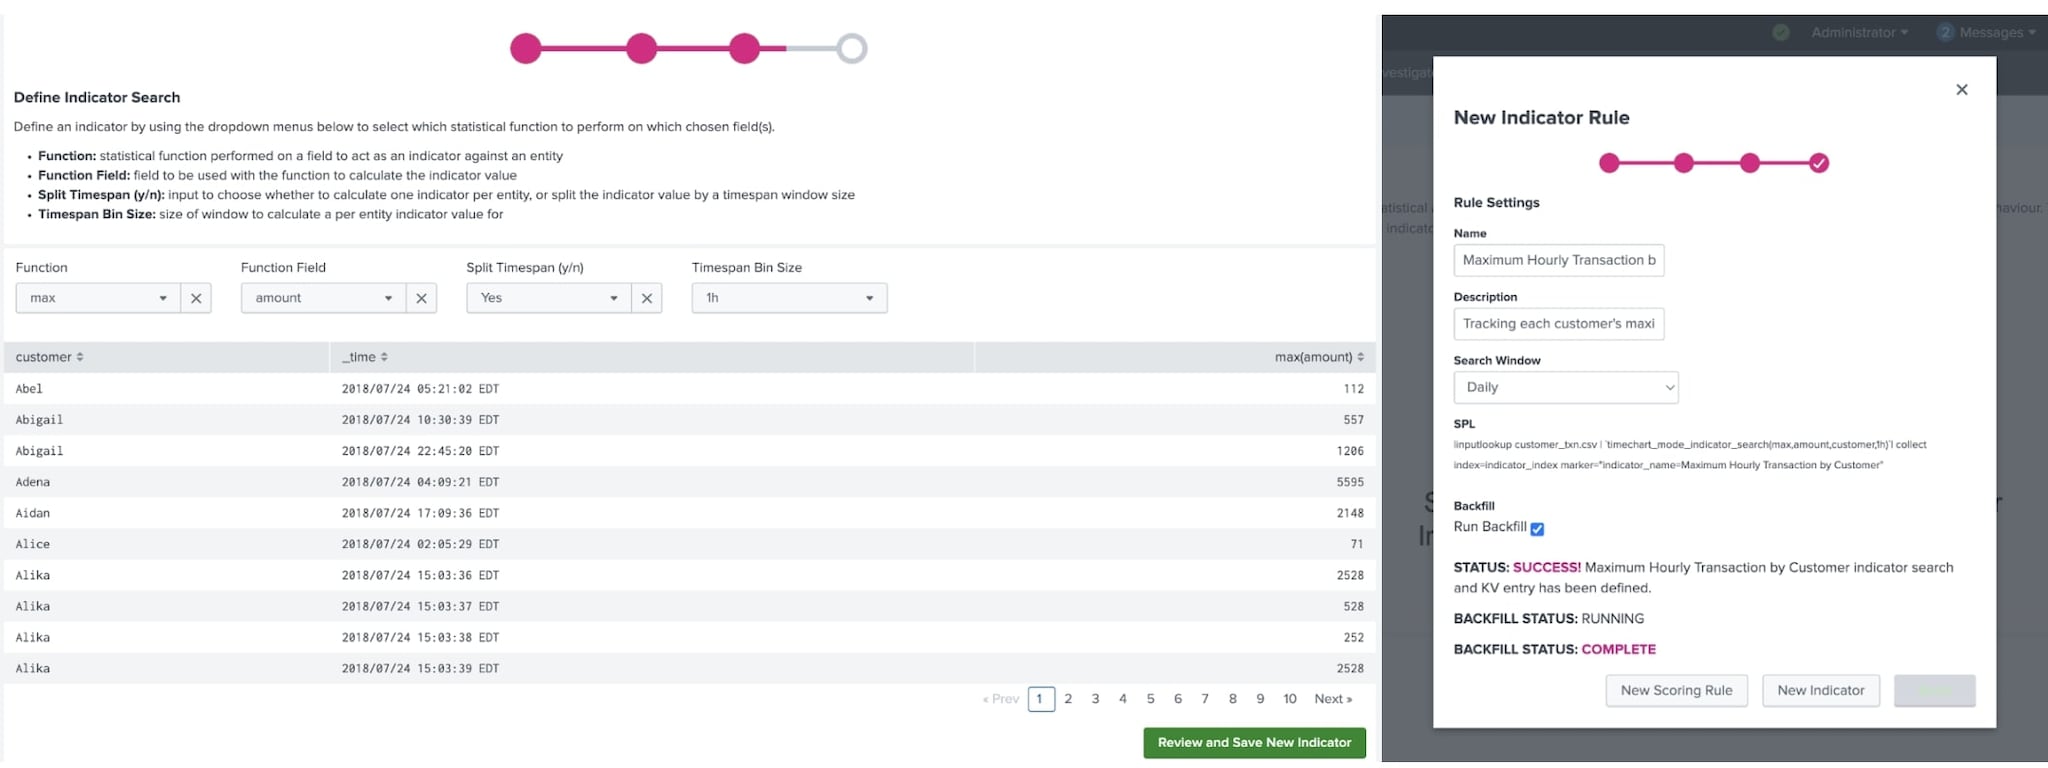
Defining and saving a new indicator rule
Scoring rules are then defined through the workflow using the data in
the indicator index. Here you can choose from static conditional logic,
standard deviation thresholding or anomaly detection powered by the
Splunk Machine Learning Toolkit to define rules for determining
anomalous behavior on either an entity by entity basis or across the
entire group.
Once the anomaly criteria has been decided, you can simply define the
scoring logic and again save, schedule and backfill the scoring rule.
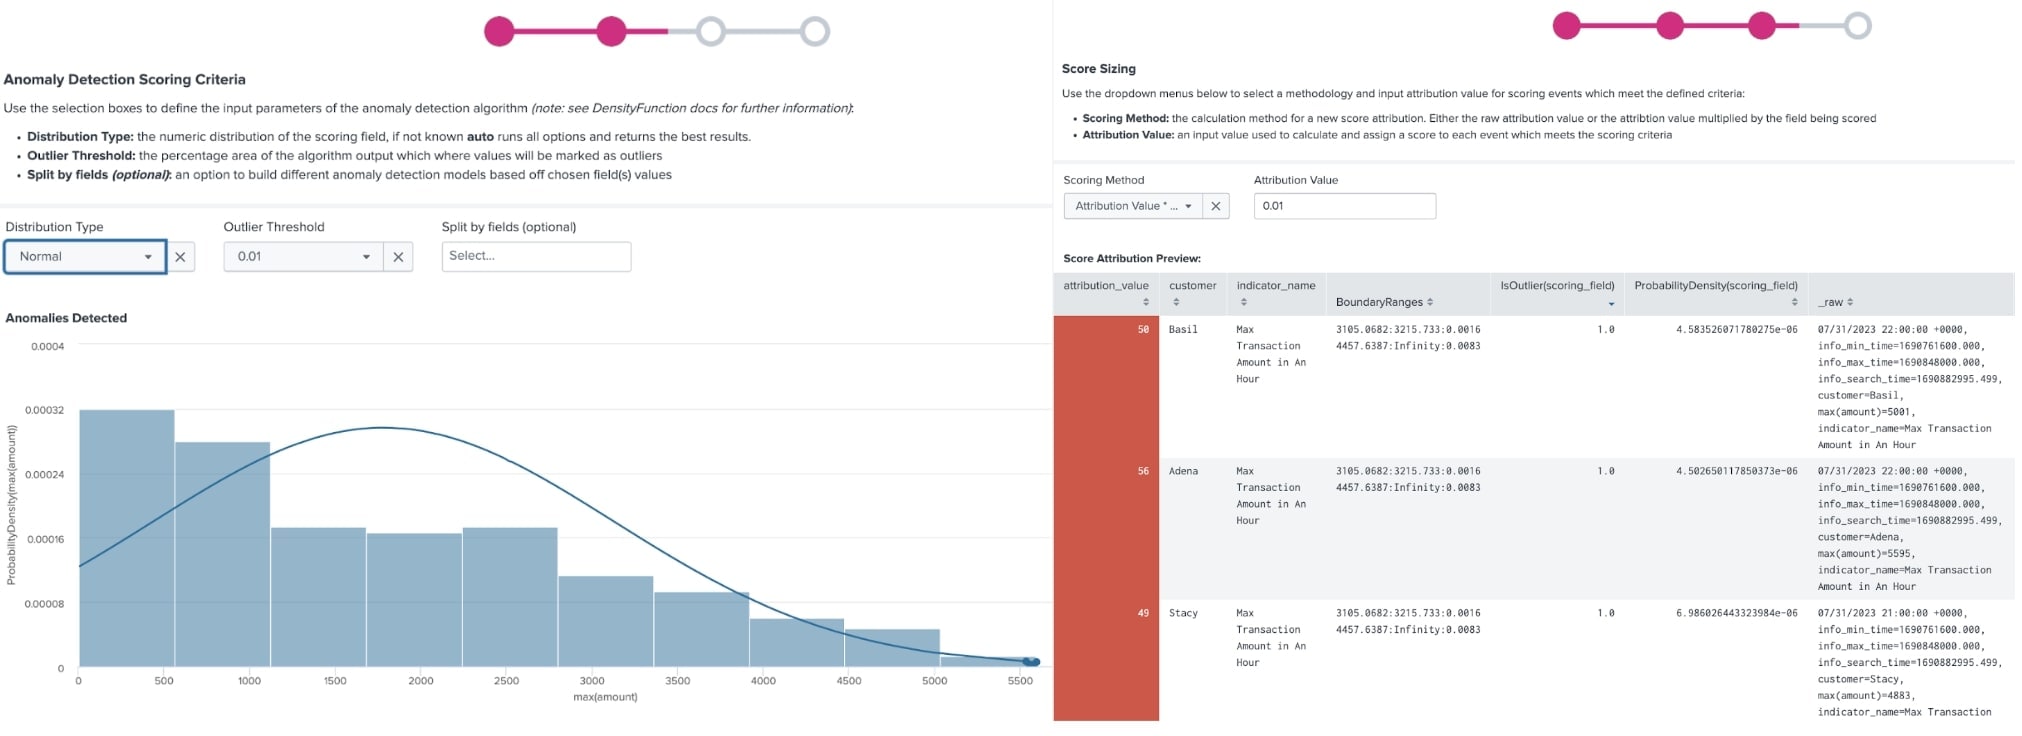
Defining the logic for determining and scoring the indicator search anomalies
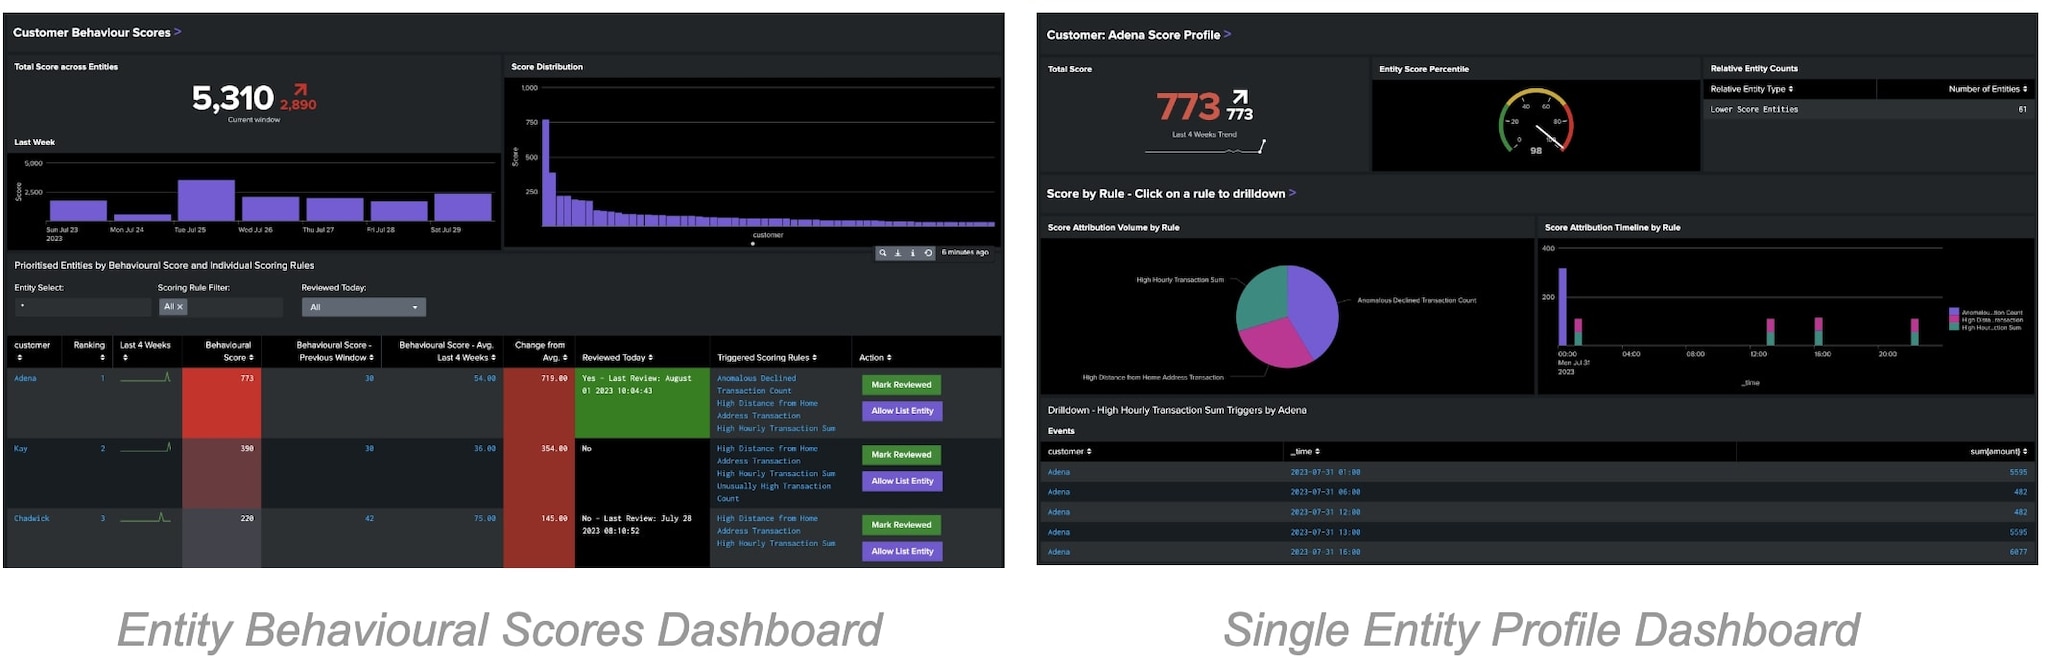
Investigate
Once a scoring rule has been deployed, its attributions will immediately be aggregated with others to populate the Entity Behavioral Scores dashboard,
which provides insight into the behavioral profile of your entities and
a prioritized list of the most anomalous. Drilling down on an entity
guides you to the Single Entity Profile view where you’ll see the
history of an entity, its individual behavioral score attributions and
the contributing raw events. From there, you can mark an entity as
reviewed or add to an allow list to remove it from all underlying
searches.
Maintain
Visibility into rule performance is critical to ensure your
environment continues to identify the most critical entities. Therefore,
the app also provides several views to ensure you can identify where
rules have drifted or run into performance issues.
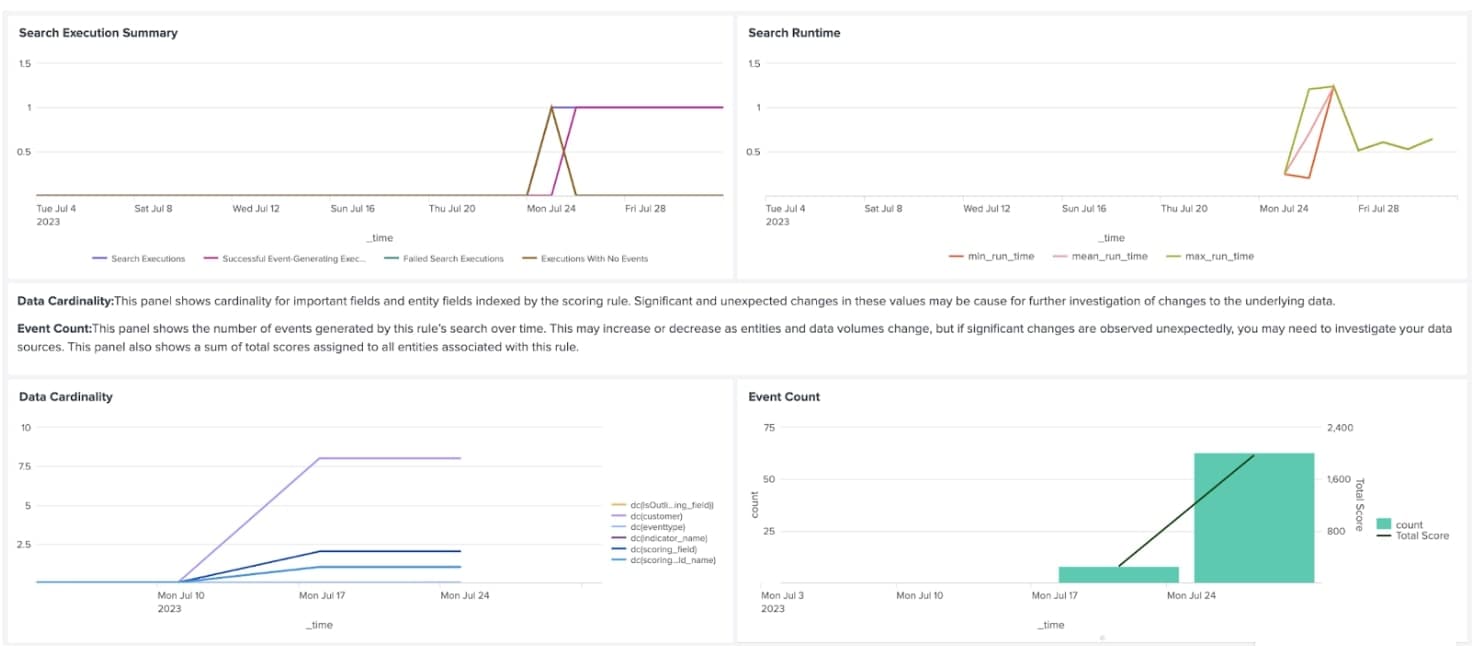
Review Scoring Rules Dashboard
The Entity Behavior Scores dashboard contains information on
the volume and scoring attributions contributed by each rule triggered,
to guide where rules should be tuned. Meanwhile the Review Indicators and Review Scoring Rules
dashboards provide operational context into the number of events
returned and search performance from your deployed searches over time.
Reference link here
A.K